NASA has unveiled stunning images of Earth’s water in new maps showcasing the planet’s global sea levels. These maps were created using data collected by the Surface Water and Ocean Topography (SWOT) satellite, which captured the varying surface heights of oceans, freshwater lakes, and rivers. The satellite’s first full 21-day science orbit, conducted from July 26 to August 16, provided the data for this animation. According to NASA’s statement, scientists are already amazed by the detailed information that SWOT is delivering on sea levels across the globe.
SWOT was launched into space on December 16, 2022, via a SpaceX Falcon 9 rocket from Vandenberg Space Force Base in California. This joint mission between NASA and the French Space Agency (CNES) involves a spacecraft that orbits Earth at an altitude of approximately 533 miles (857 kilometers) and measures water levels over 90% of the planet’s surface every 21 days, documenting global water level changes.
Aside from providing captivating visuals, this data will significantly contribute to climate change research and help communities worldwide prepare for a warming planet. The animation was generated using information from the satellite’s Ka-band Radar Interferometer (KaRIn) instrument, which employs radar pulses to measure surface heights by bouncing them off the water’s surface.
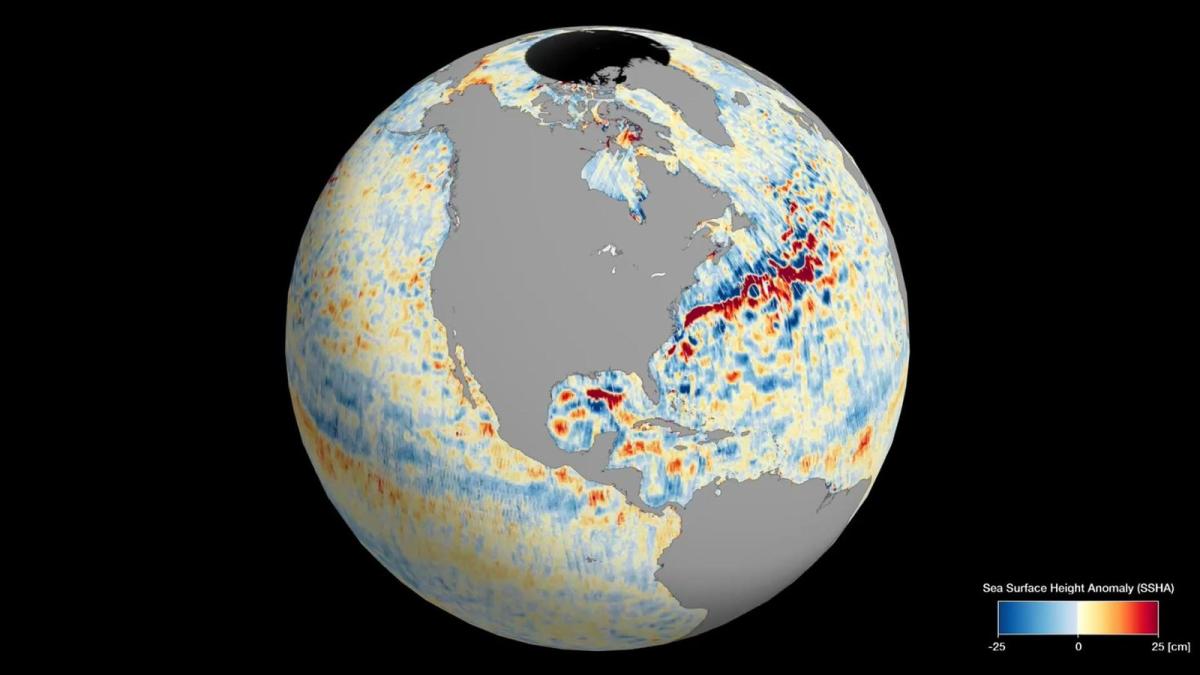
In addition to showcasing varying sea surface heights, the animation highlights areas where water levels exceed or fall below the global mean sea surface height. Red and orange regions represent higher-than-average water levels, while blue areas indicate lower-than-average levels. NASA officials assert that the data collected by SWOT offers an unparalleled level of detail and comprehensiveness in understanding Earth’s surface water.
“Sea level differences can highlight ocean currents, like the Gulf Stream coming off the U.S. East Coast or the Kuroshio current off the east coast of Japan,” said NASA officials. “Sea surface height can also indicate regions of relatively warmer water – like the eastern part of the equatorial Pacific Ocean during an El Niño – because water expands as it warms.”
